From the buoy
Current reef status
Sample data, simulated until the buoy is deployed. Span 2026-08-14 → 2026-09-12.
Bleaching alert
No Stress
Latest temp
26.5 °C
Completeness
100%
Turbidity events
123

Background
The gap is affordable data from shallow, nearshore water.
Coral reefs are among the most threatened ecosystems on Earth, but the instruments used to monitor them cost tens of thousands of dollars and are often serviced only every few years. When we interviewed reef scientists, they pointed to the same gap: affordable measurements in the shallow nearshore water where satellite products lose accuracy.
S.C.O.U.T. is designed to run unattended, on battery power, low maintenance, and a modular sensor payload. The target system cost is under $5,000, the figure researchers gave as a practical ceiling.
What it measures
One sensor per measurement sits below the buoy. The electronics stay sealed above the waterline, and readings are logged on board before transmission.
Signal 01
A digital thermometer provides the temperature record used to compute NOAA Coral Reef Watch thermal-stress metrics.
Signal 02
An optical sensor detects runoff, resuspension, and sediment plumes as changes relative to the site's baseline.
Signal 03
A hydrophone records the reef's acoustics on board. The audio is stored locally and retrieved by hand — never sent over the radio — then analysed for bioacoustic signs of reef health.
Signal 04
Battery state-of-health and daily minimum voltage track whether the battery power budget is holding up over a long deployment.
A platform
The sensor payload is modular. Dissolved oxygen, light, chlorophyll, and reef soundscapes are on the roadmap. Coral-reef health is the first application, with others planned.
See the architectureThe environment
S.C.O.U.T. is built for shallow nearshore water. It is biodiverse and productive, and it is also where remote sensing is least accurate.

Noemi Merz / Ocean Image Bank
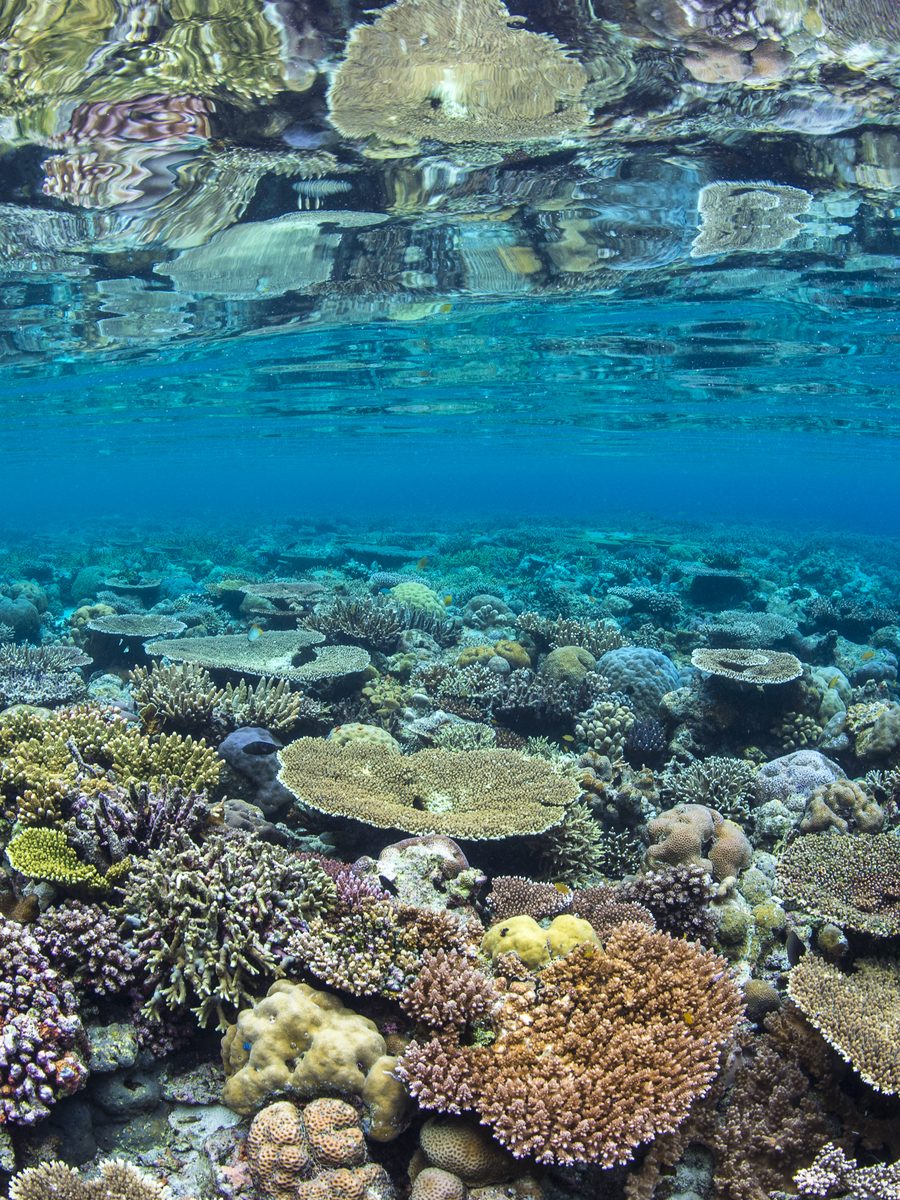
Alex Mustard / Ocean Image Bank

Jordan Robins / Ocean Image Bank

Cinzia Osele Bismarck / Ocean Image Bank

Gabriel Barathieu / Ocean Image Bank
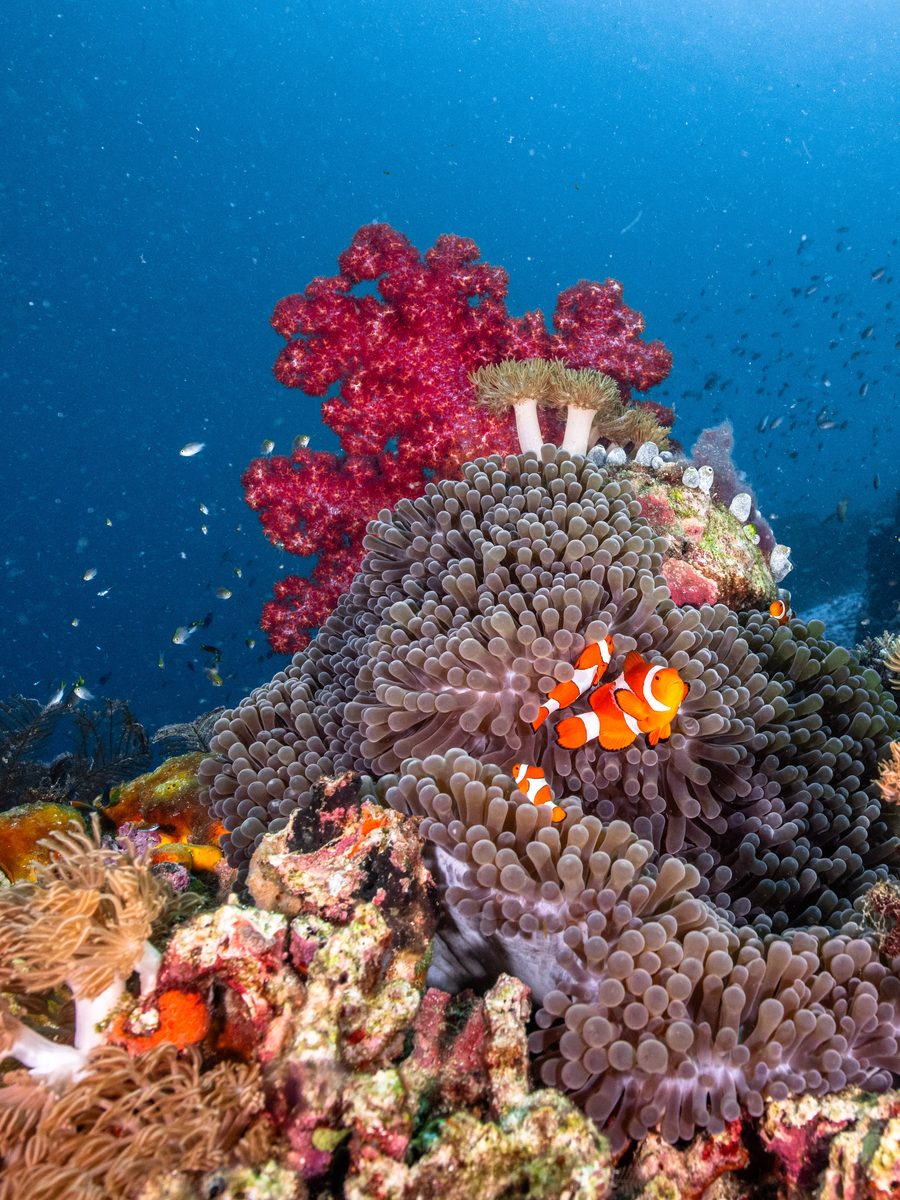
Dani Escayola / Ocean Image Bank

Tracey Jennings / Ocean Image Bank
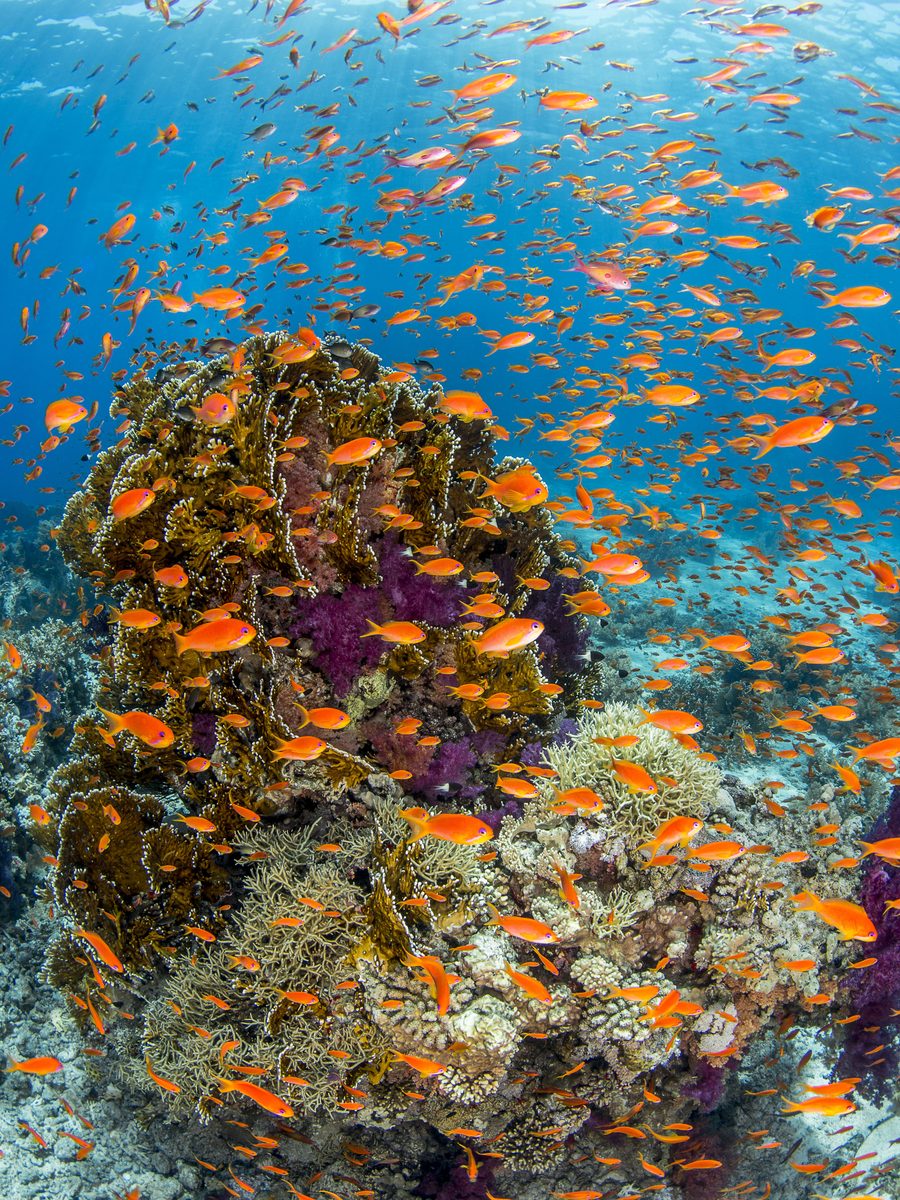
Renata Romeo / Ocean Image Bank
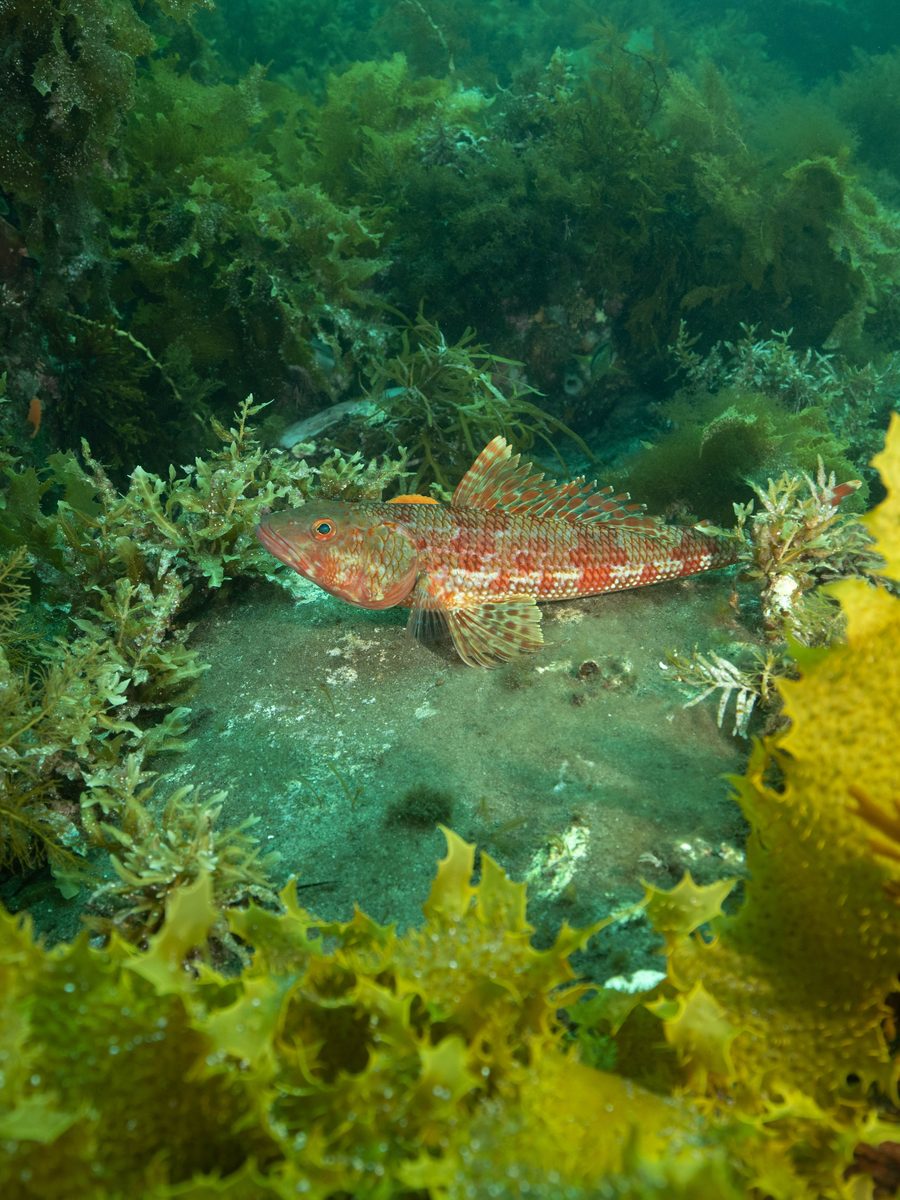
Stefan Andrews / Ocean Image Bank

Kurt Arrigo / Ocean Image Bank
Mechanical design
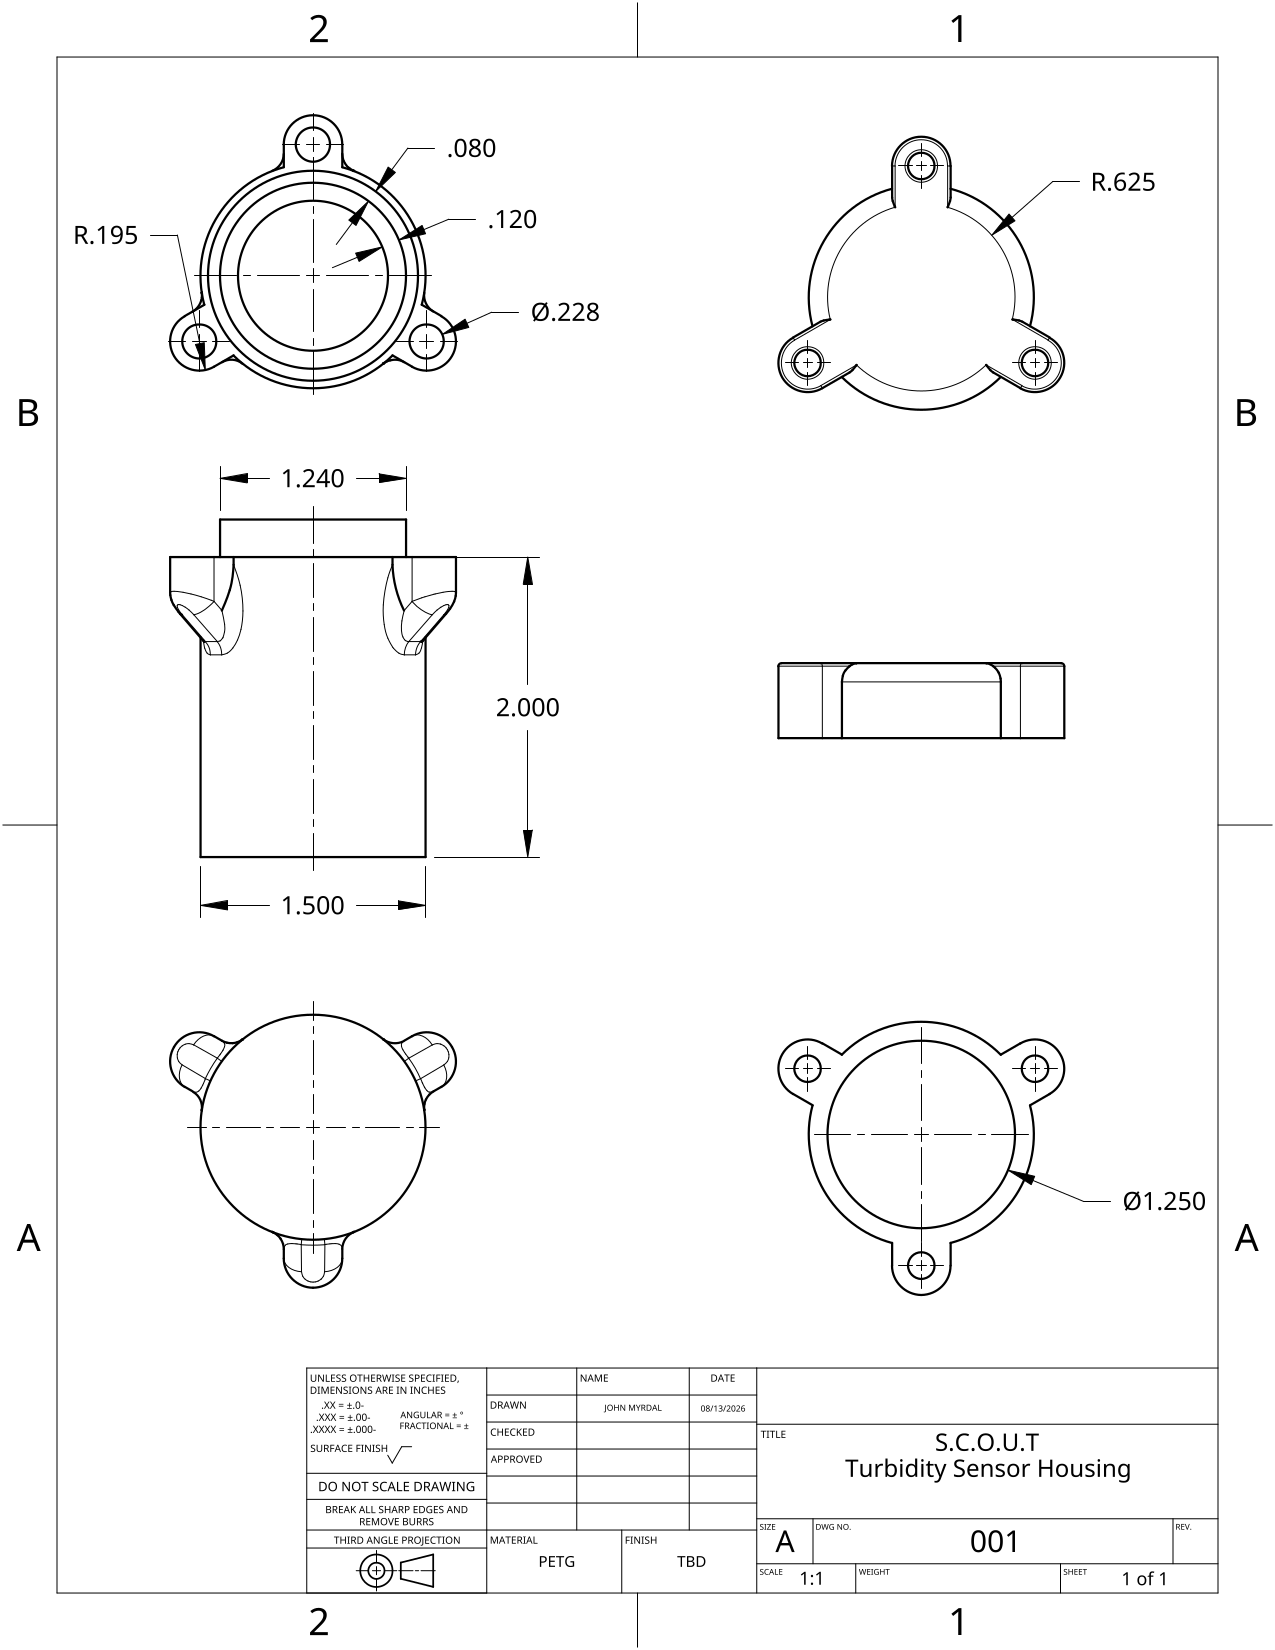
CAD drawings by John Ryan Myrdal. The two printed floats, the electronics housing and its cap, and the turbidity-sensor housing, printed in PETG.
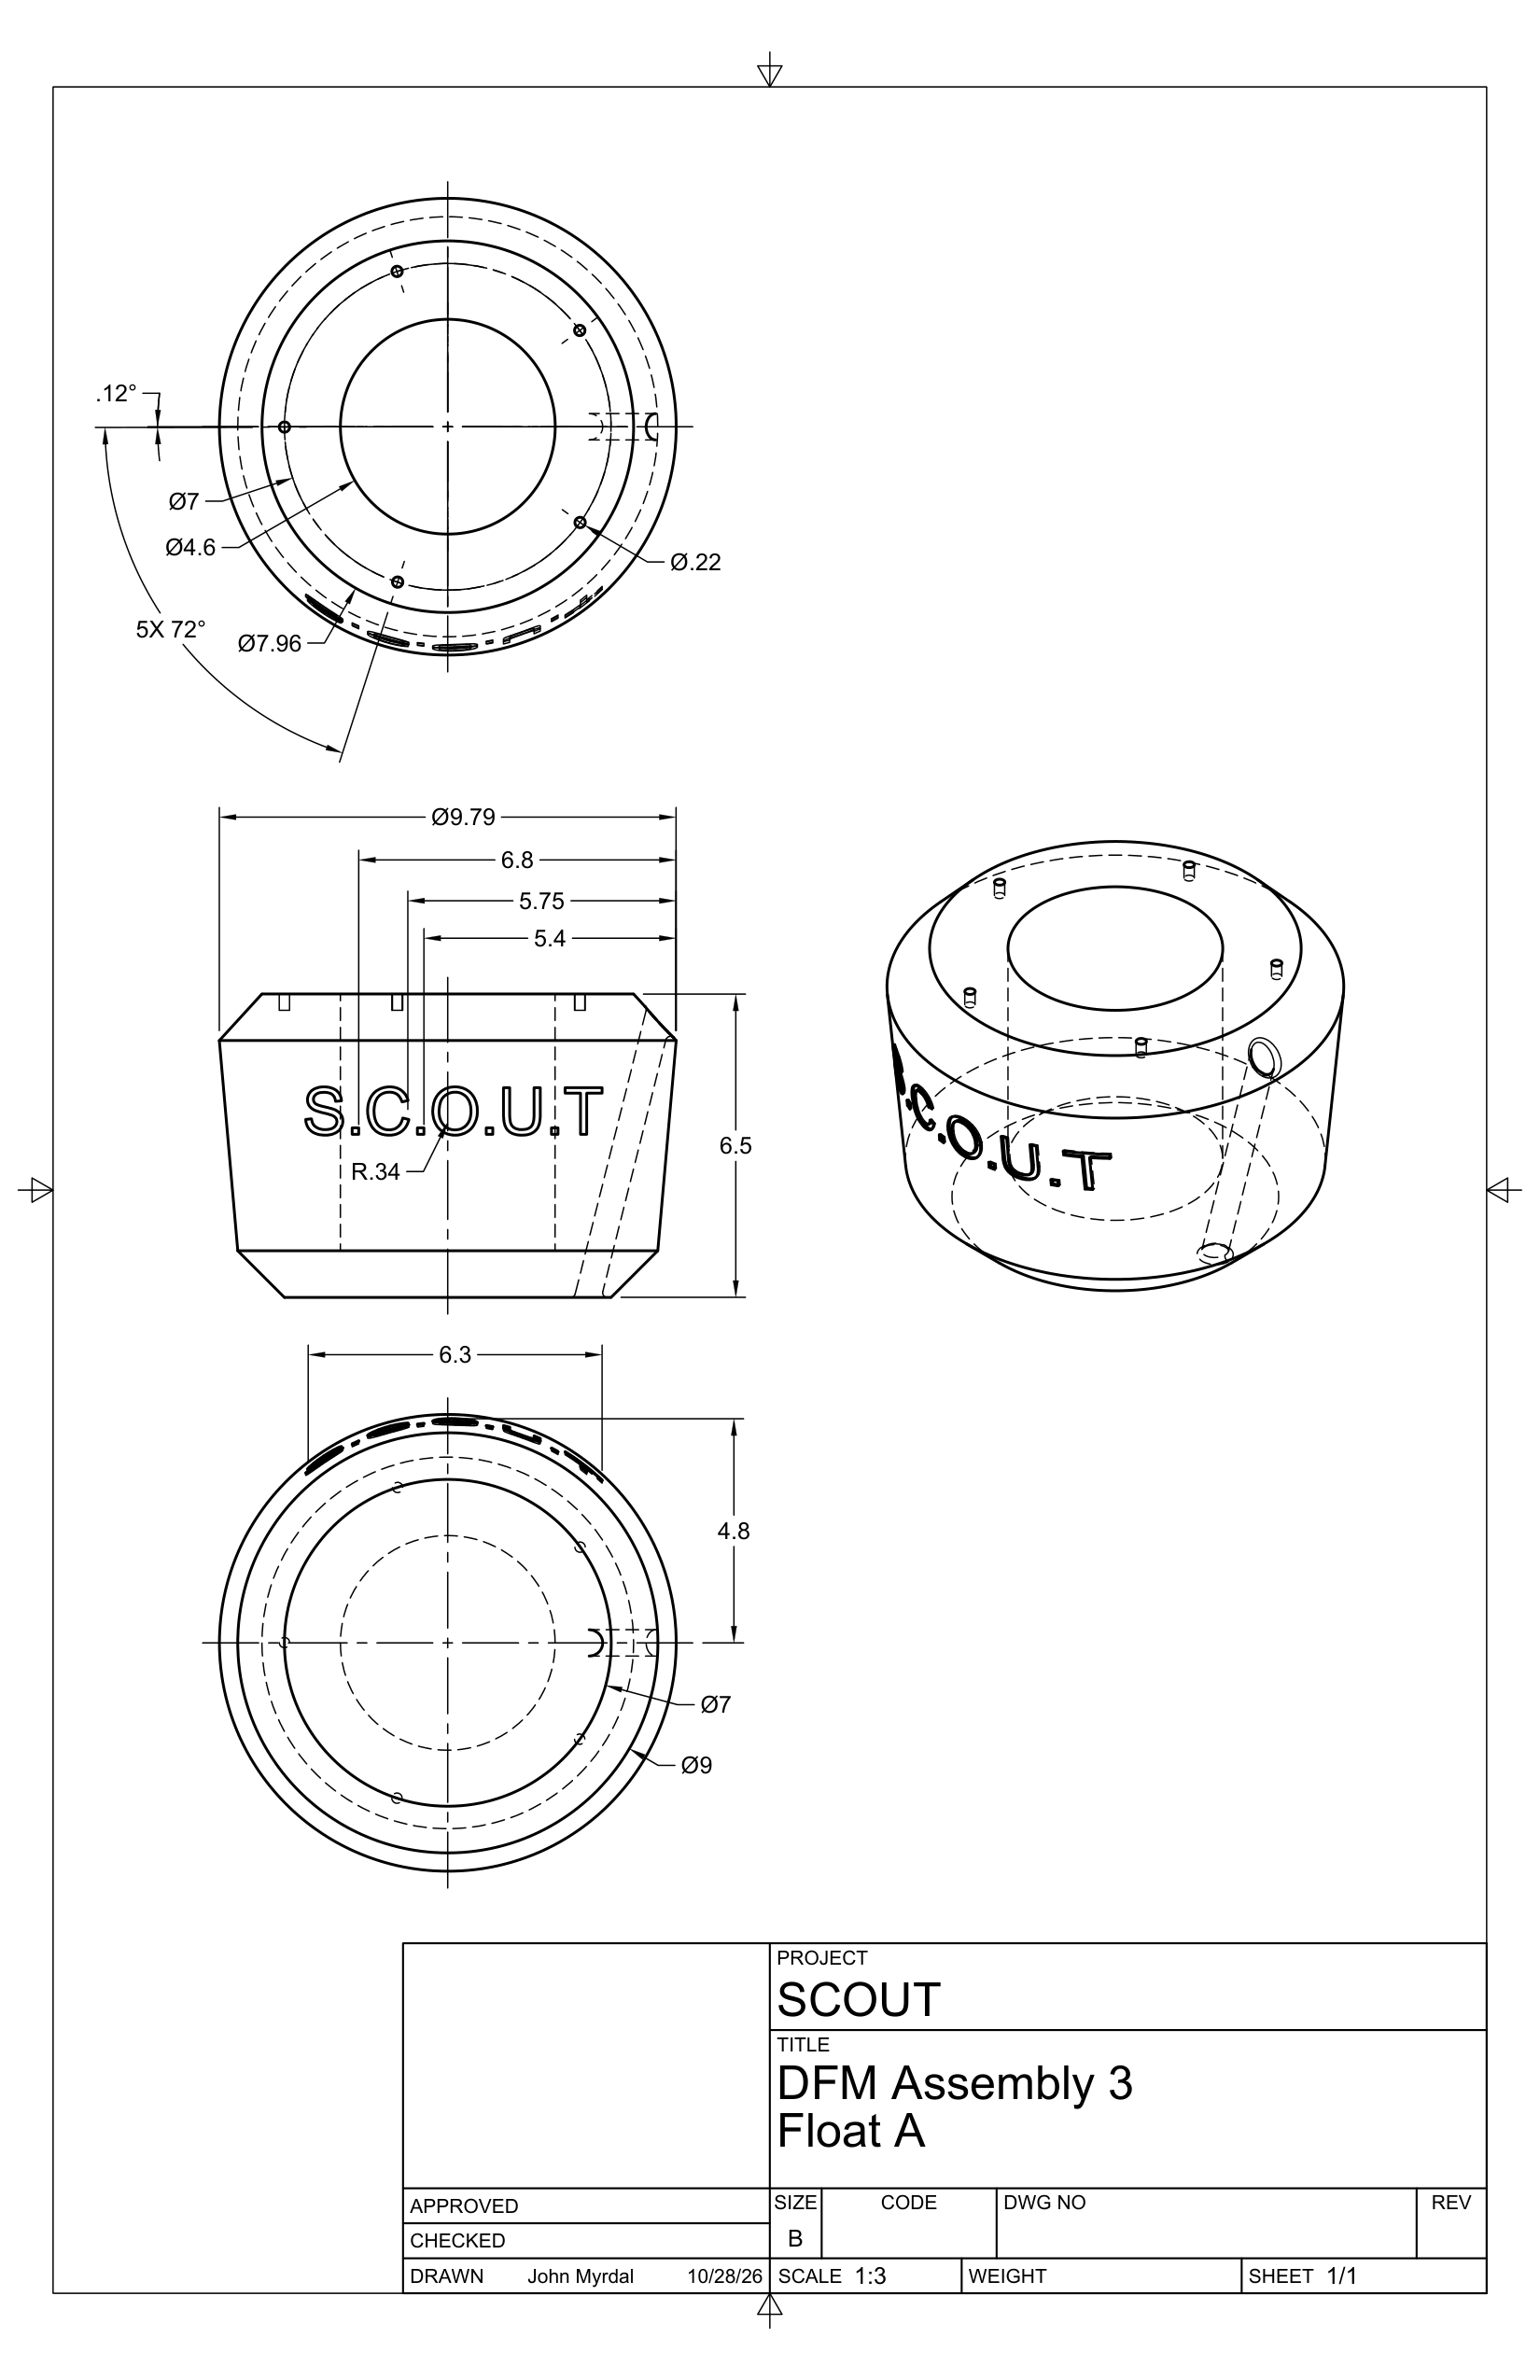
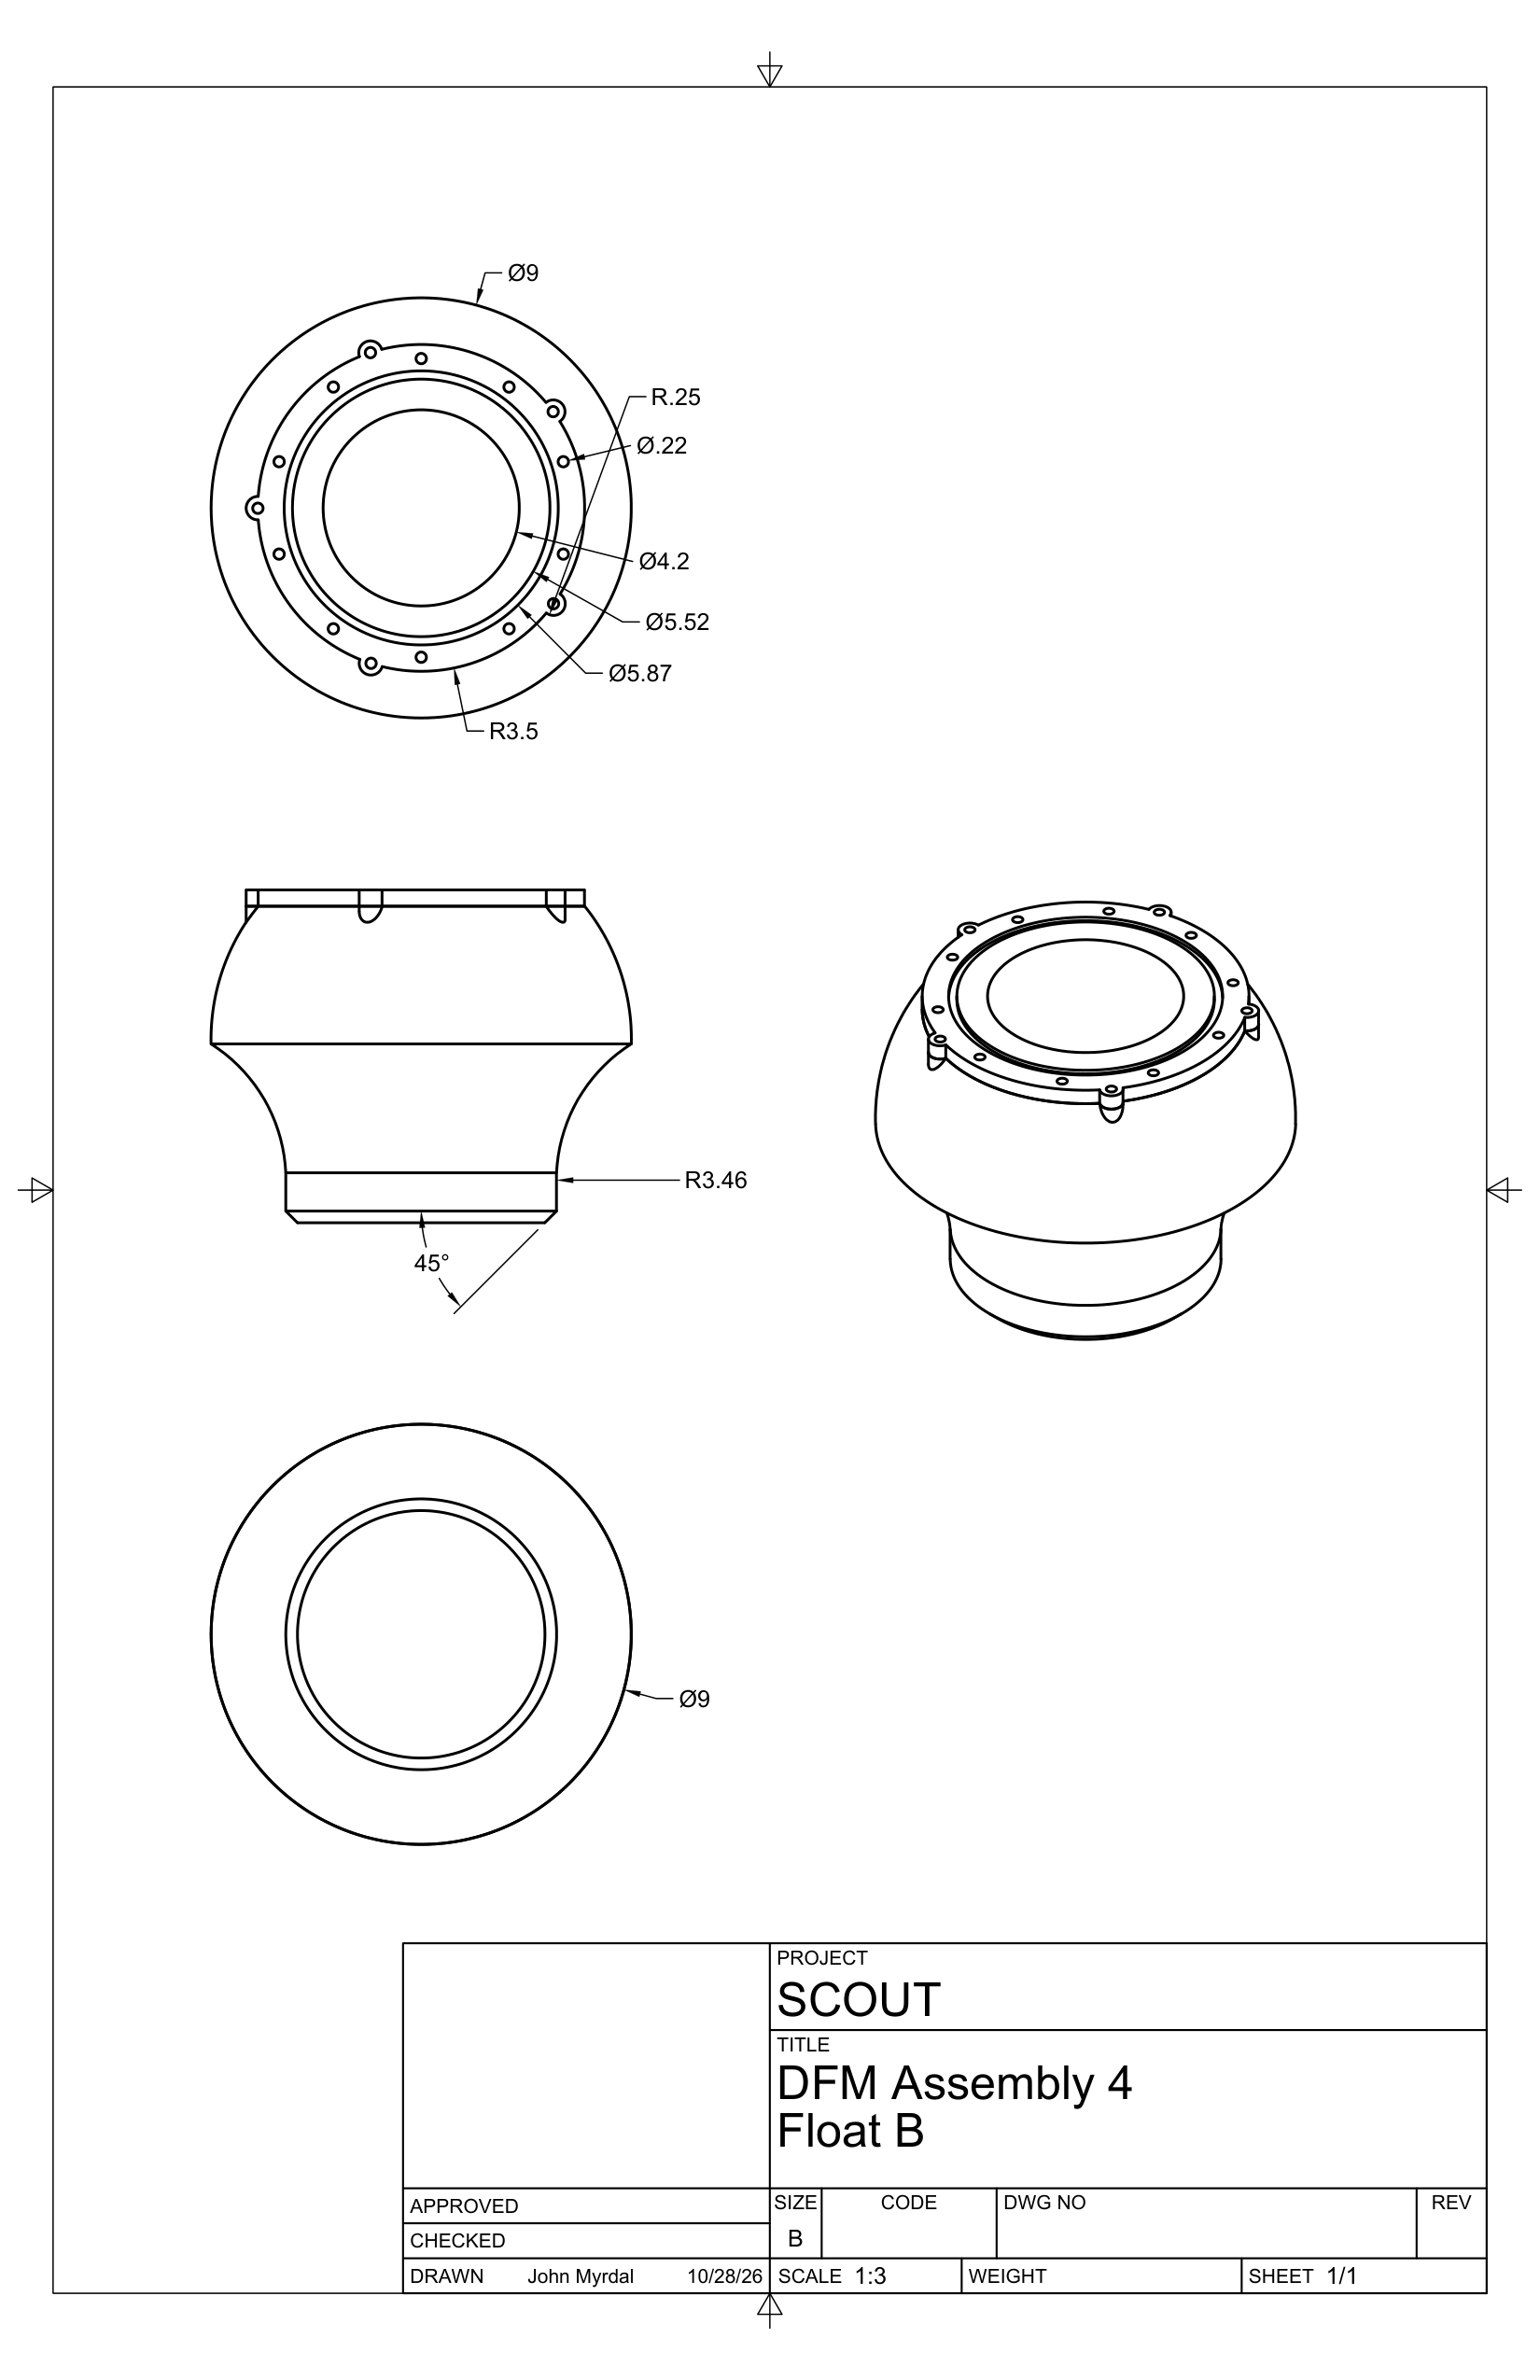
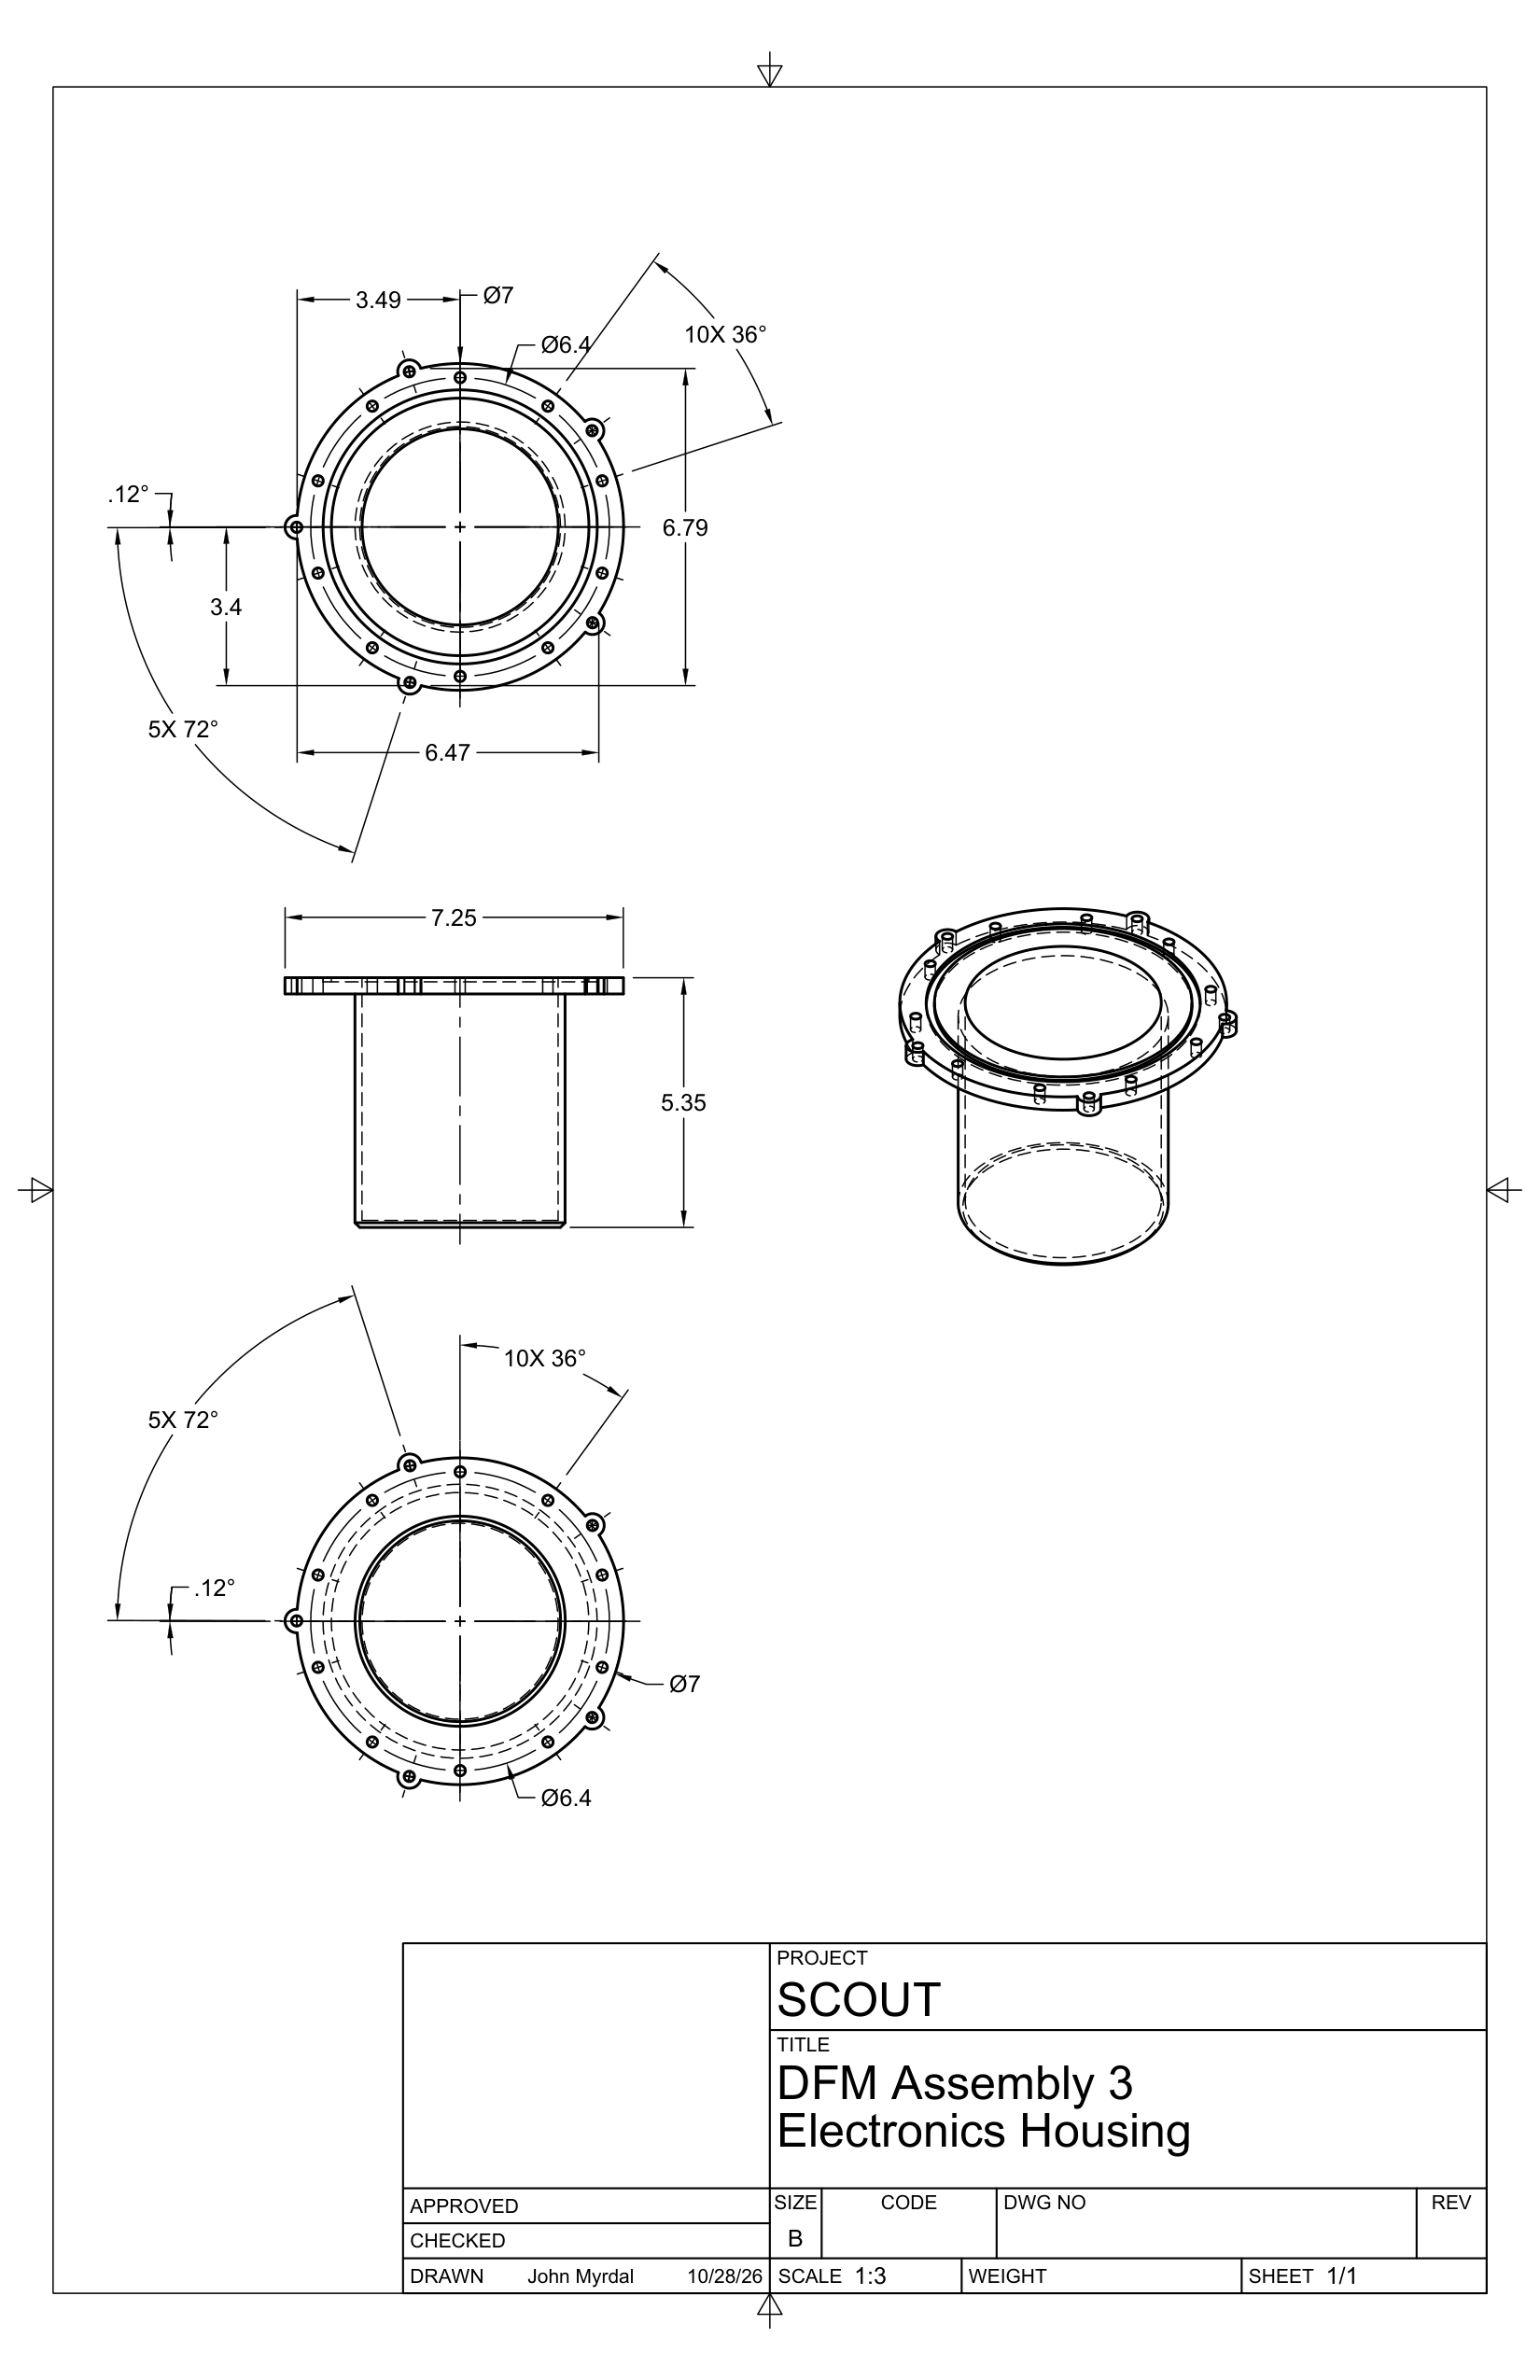
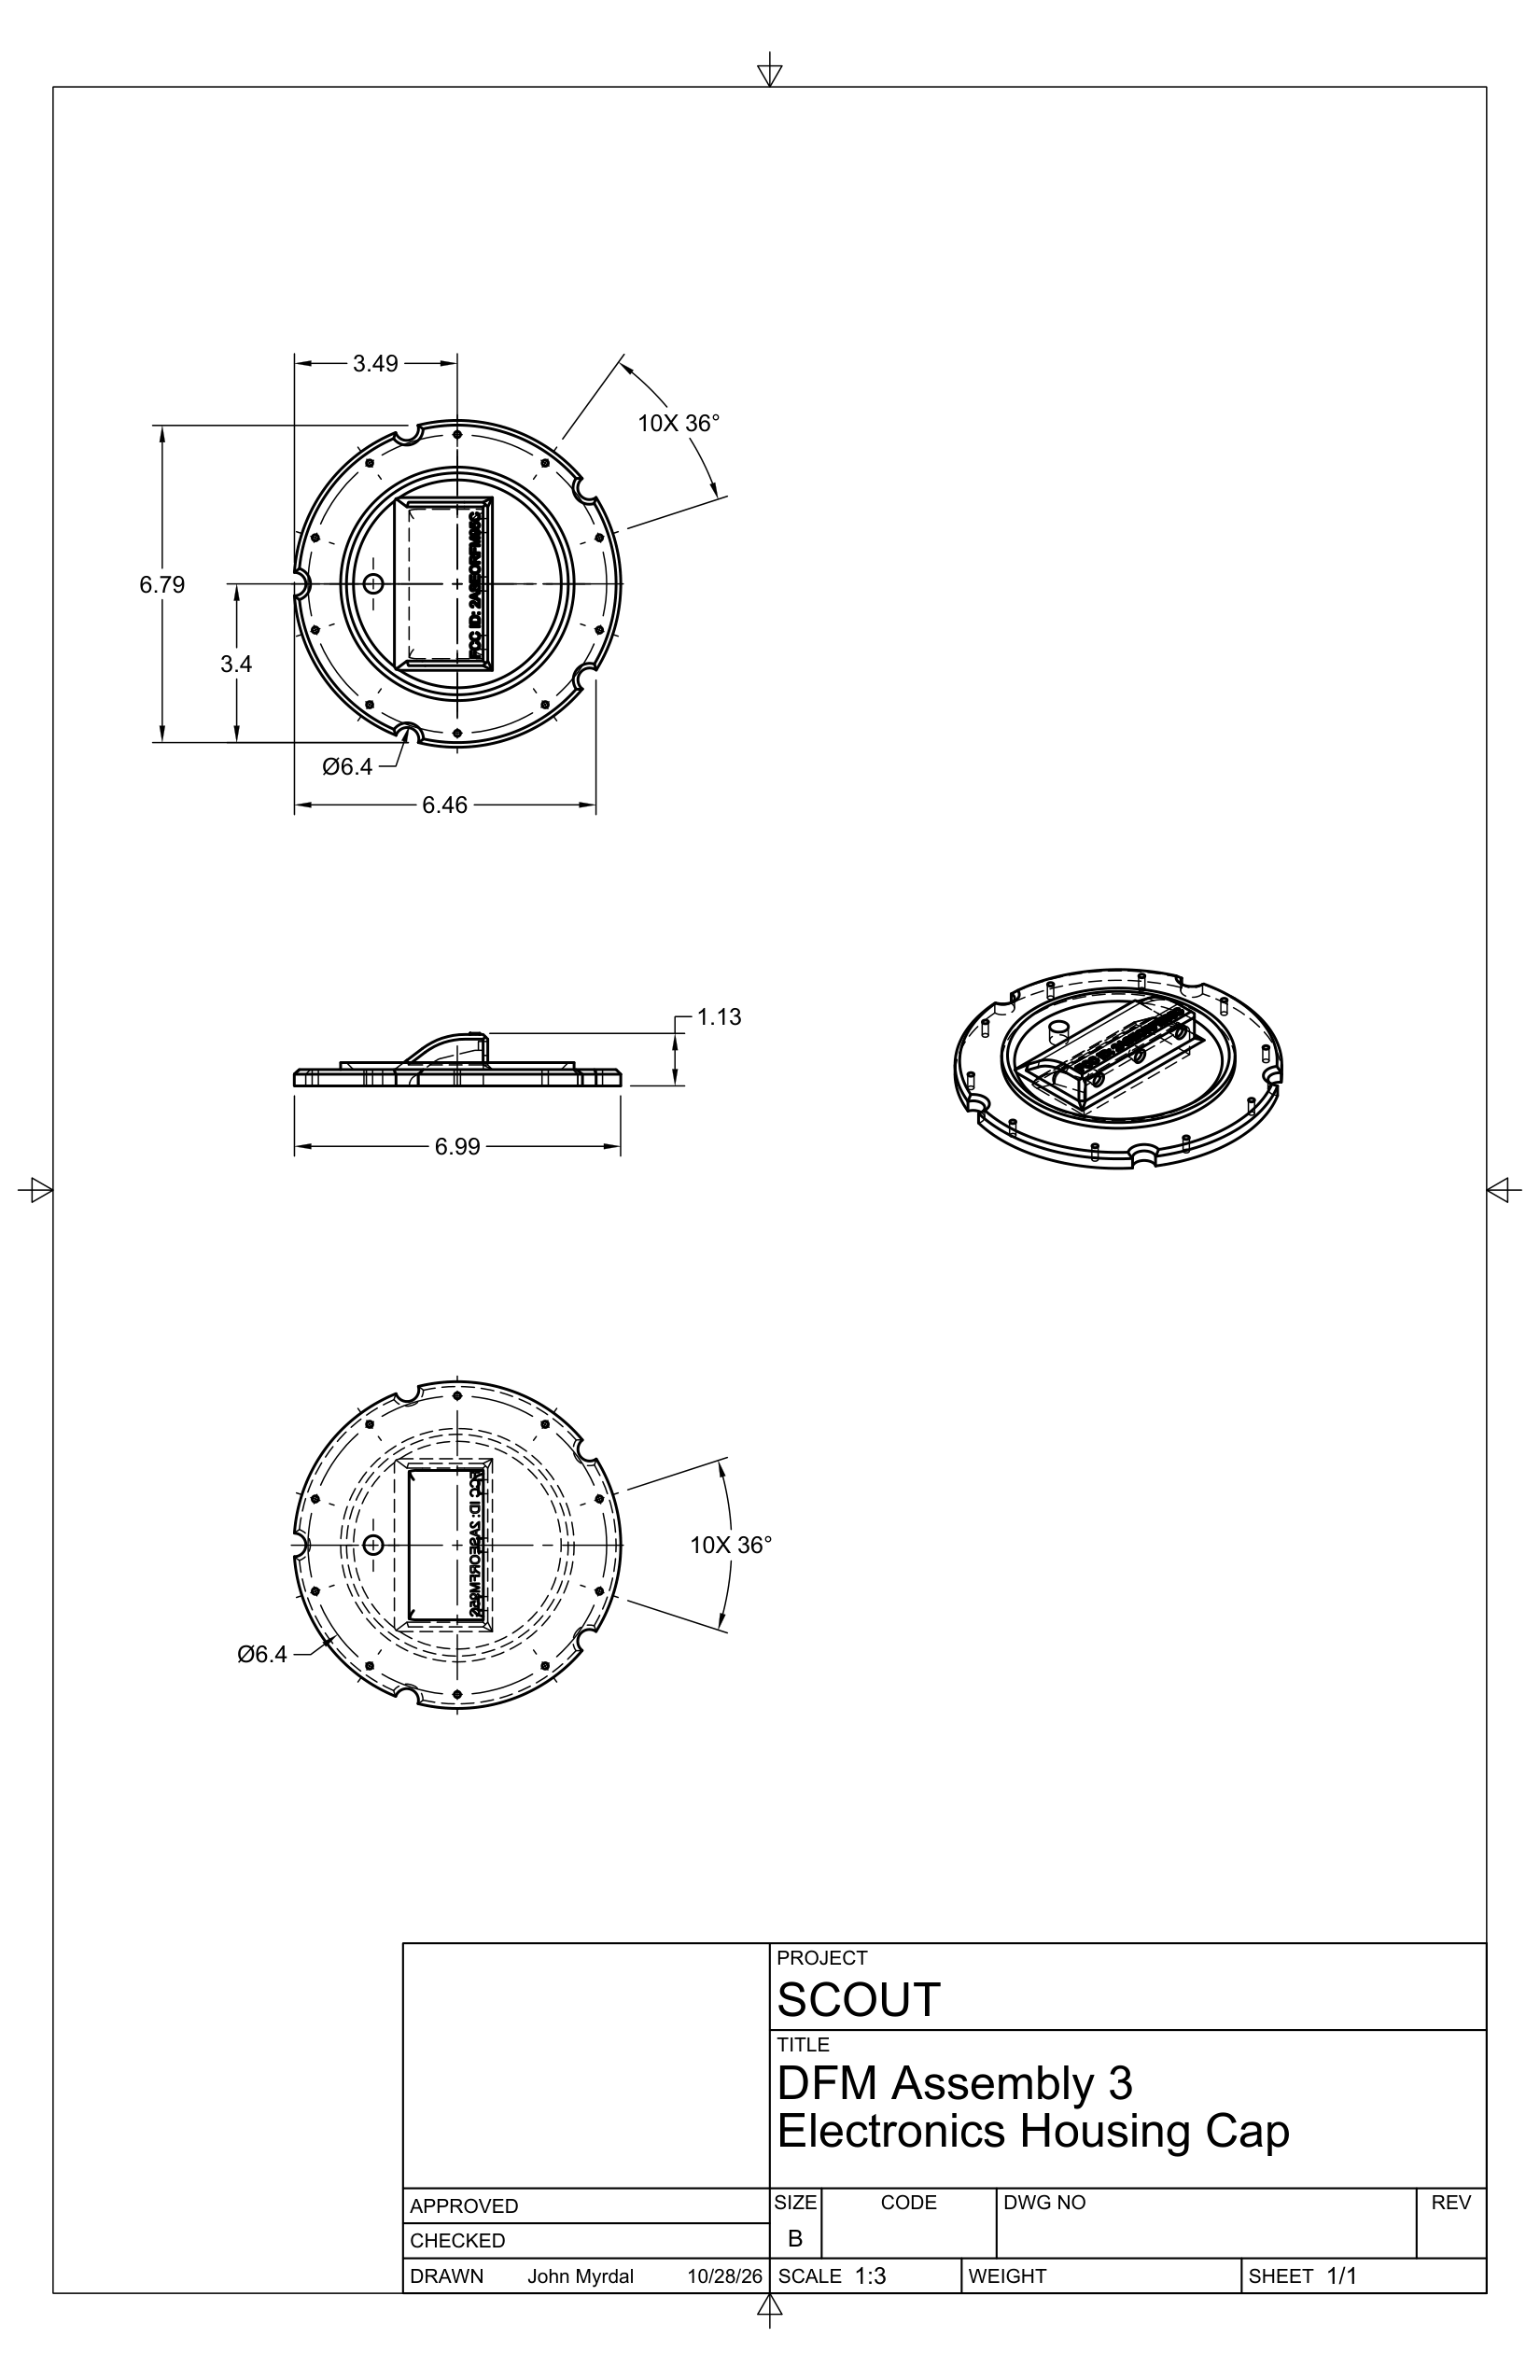
How it works
The buoy wakes about every 30 minutes, reads water temperature and battery voltage, samples turbidity less often, and returns to sleep.
Each wake appends one row to an on-board CSV log, timestamped in UTC. Raw data never leaves the buoy: the full archive, audio included, stays in on-board storage and is retrieved by hand.
Three times a day, at 00:10, 08:10 and 16:10 UTC, the buoy sends its latest reading to shore as a 44-byte packet over a 915 MHz LoRa link, roughly 2 km line of sight. No cellular service or internet is used at the buoy.
On shore, an ESP32-S3 base station receives each packet and forwards it over WiFi. The telemetry pipeline validates it, runs quality control and NOAA Coral Reef Watch thermal-stress metrics, and regenerates this dashboard, using only the Python standard library.
From the buoy
Sample data, simulated until the buoy is deployed. Span 2026-08-14 → 2026-09-12.
Bleaching alert
No Stress
Latest temp
26.5 °C
Completeness
100%
Turbidity events
123
