01 · Quality control
Quality control
The pipeline reports completeness against the 30-minute cadence, along with gaps, duplicates, and implausible readings. It does not drop or interpolate data.
Science
S.C.O.U.T.'s readings only mean something in the context of established reef science. This page explains what it tracks, the thermal-stress and bioacoustic methods behind the numbers, and their limitations.
What S.C.O.U.T. tracks
S.C.O.U.T. samples a small set of environmental signals and turns each into a reviewed metric. Temperature and turbidity transmit daily; the reef soundscape is recorded and analysed on board.
| Signal | Sensor | What S.C.O.U.T. derives |
|---|---|---|
| Water temperature | Digital thermometer (DS18B20) | Daily mean, HotSpot, Degree Heating Weeks, bleaching alert level |
| Turbidity | Optical transmittance sensor (Seeed Grove) | Daily median, relative anomaly events (runoff, resuspension, plumes) |
| Battery & power | Bus voltage | Daily minimum, state-of-health, data completeness |
| Reef soundscape | Hydrophone | ACI, BI, NDSI, H, ADI, an Acoustic Quality Score, and their trends |
| Dissolved oxygen · light · chlorophyll | Roadmap | Planned additions to the modular sensing payload |
Heat and bleaching
S.C.O.U.T. uses NOAA Coral Reef Watch's operational framework, the standard method for anticipating mass coral bleaching.
Warning tiers
| Level | Condition | Meaning |
|---|---|---|
| No Stress | HotSpot ≤ 0 | At or below the climatological maximum |
| Bleaching Watch | 0 < HotSpot < 1 °C | Warm, not yet stressful |
| Bleaching Warning | HotSpot ≥ 1 °C, DHW < 4 | Risk of possible bleaching |
| Alert Level 1 | HotSpot ≥ 1 °C, 4 ≤ DHW < 8 | Risk of reef-wide bleaching |
| Alert Level 2 | HotSpot ≥ 1 °C, 8 ≤ DHW < 12 | Reef-wide bleaching; heat-sensitive corals die |
| Alert Level 3 | HotSpot ≥ 1 °C, 12 ≤ DHW < 16 | Risk of multi-species mortality |
| Alert Level 4 | HotSpot ≥ 1 °C, 16 ≤ DHW < 20 | Severe mortality, over half of corals |
| Alert Level 5 | HotSpot ≥ 1 °C, DHW ≥ 20 | Near-complete mortality, over 80% of corals |
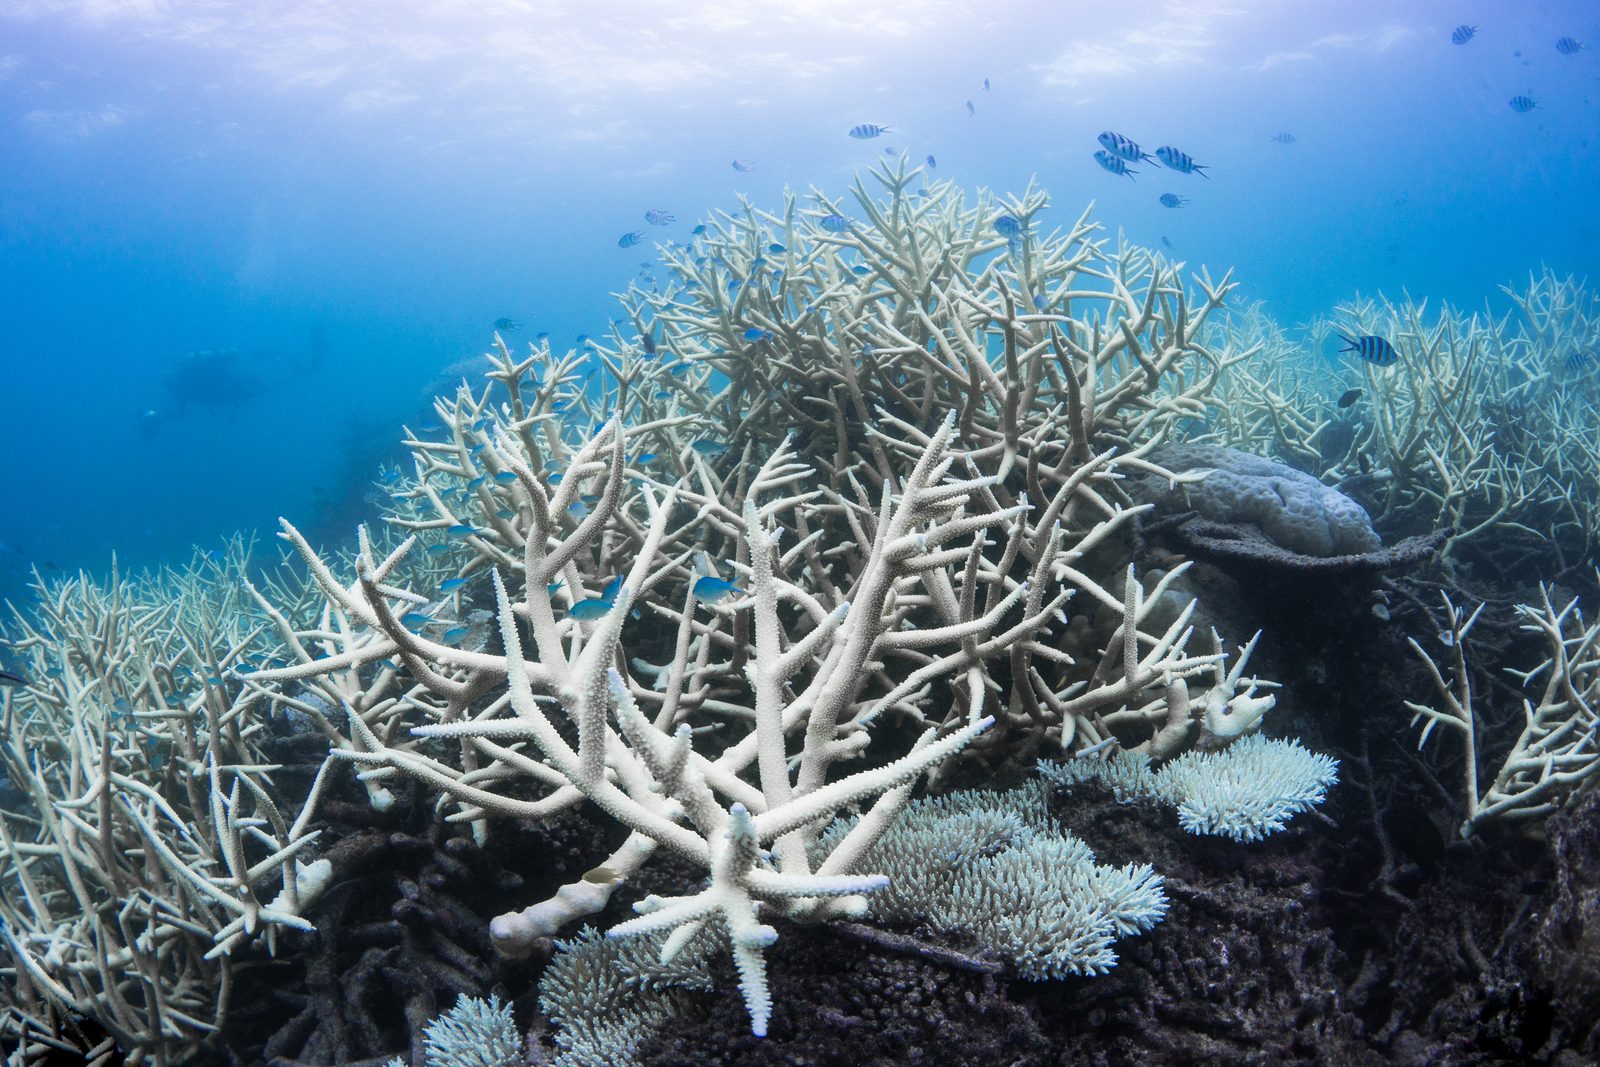
The Ocean Agency / Ocean Image Bank
Reef soundscapes
A healthy reef is loud: snapping shrimp, fish choruses, and the movement of the reef itself. S.C.O.U.T. records the soundscape and reduces it to established bioacoustic indices, a biological signal that complements the temperature and turbidity record.
ACI
Captures the rapid intensity fluctuations typical of biological sound (fish and invertebrate calls) while ignoring steady background noise.
BI
The acoustic energy in the biophony frequency band, a proxy for how much biological sound the reef is producing.
NDSI
The balance between biological and anthropogenic frequency bands. A higher value means a more natural soundscape.
H
The evenness of acoustic energy across time and frequency. A richer, more even soundscape scores higher.
ADI
The diversity of occupied frequency bands, a Shannon index computed across the spectrum.
AQS
A single reef-health score per session, from a PCA that combines the five indices into one number.
A three-zone frequency model carves out a 200–1000 Hz mixed band and excludes it from NDSI, because the usual two-way split misclassified reef-fish choruses as anthropogenic noise. Median aggregation and an abiotic contamination filter keep the indices robust against wind- and rain-affected recordings at 1.5 m depth.
Health scoring uses a PCA fit within each session, so scores are not comparable across sessions; a separate global PCA drives longitudinal trend detection with modified Mann-Kendall tests.
The pipeline is validated on a published reef dataset from Sesoko Island, Okinawa: eight monthly sessions from August 2017 to July 2018, a stand-in until S.C.O.U.T. records its own audio.
Raw audio never leaves the buoy. Waveform data is far too large for a 44-byte LoRa packet, so the buoy stores recordings on board and transmits only a 14-byte summary of each one: three band levels, an NDSI estimate, a snap count and a clip count.
Processing
Every environmental stage runs on the Python standard library, so it runs anywhere Python 3 does, with nothing to install.
01 · Quality control
The pipeline reports completeness against the 30-minute cadence, along with gaps, duplicates, and implausible readings. It does not drop or interpolate data.
02 · Daily aggregation
A day is given a mean temperature only if at least 50% of its samples are present. Sparse days keep their place on the calendar but contribute no temperature.
03 · Turbidity
Because the sensor is uncalibrated, it reports relative events rather than NTU, using an Iglewicz–Hoaglin modified z-score on the raw samples.
04 · Trends
A non-parametric, outlier-robust test for monotonic change, with an autocorrelation correction when available. Statistical power is limited early in a deployment.
Limitations
Diurnal bias. CRW builds daily SST from nighttime satellite retrievals to suppress skin warming. A shallow surface buoy sees a real diurnal cycle, so its daily mean can run slightly warm. The pipeline reports daily coverage so this is auditable.
Gap bias. DHW over a window with missing days sums only the days present, which biases it low. The pipeline reports each day's window coverage.
MMM dependency. Results are only as good as the supplied climatology. For Hawaii, the MMM is read from the CRW 5 km product for the deployment cell.
Uncalibrated turbidity. Output is in ADC counts, not NTU, so S.C.O.U.T. reports relative events only. A calibration curve against turbidity standards is a documented follow-up.
Acoustic scores are relative. The indices track change within a deployment rather than an absolute measure of biodiversity, and they are validated against a single reference reef. S.C.O.U.T. has not yet recorded its own audio.
References
Thermal-stress and turbidity methods, then reef bioacoustics. Full citations with DOIs are in the methodology documents.
See it live
